

- Single Image File
Change in the age of ice on the Arctic Ocean, comparing September ice ages in 1988, 1990, 2001 and 2005
The age of sea ice in the Arctic is changing, and not only the extent and concentrations. Studies show that in recent years there…

- Single Image File
Trends in snow-covered area for the Northern Hemisphere 1922-2005
Observations of snow-covered area for the Northern Hemisphere show a significant development in the later 20th century, with a reduction of the area covered…

- Single Image File
The Cryosphere, components and world maps
Snow and the various forms of ice - the cryosphere - play different roles within the climate system. The two continental ice sheets of…

- Single Image File
Permafrost extent in the Northern Hemisphere
Permafrost zones occupy up to 24 per cent of the exposed land area of the Northern Hemisphere. Permafrost is also common within the vast…

- Single Image File
Average recurrence interval for sea-level events of a given height at Sydney, Australia
For the second half of the 20th century (red line), the average recurrence interval for a sea-level height of a given value is less…

- Single Image File
Greenland, showing rates of surface-Elevation change between the late 1990s and 2003
Mass-balance estimates for Greenland show thickening at high elevations since the early 1990s at rates that increased to about 4 cm per year after…

- Single Image File
Topographic map Antarctica
Antarctic is the fifth largest continent of the world at 14 million square kilometres and is covered by a permanent continental ice sheet. The…

- Single Image File
Trends in sea level, 1870-2006
Coastal and island tide-gauge data show that sea level rose by just under 20 cm between 1870 and 2001, with an average rise of…
- Single Image File
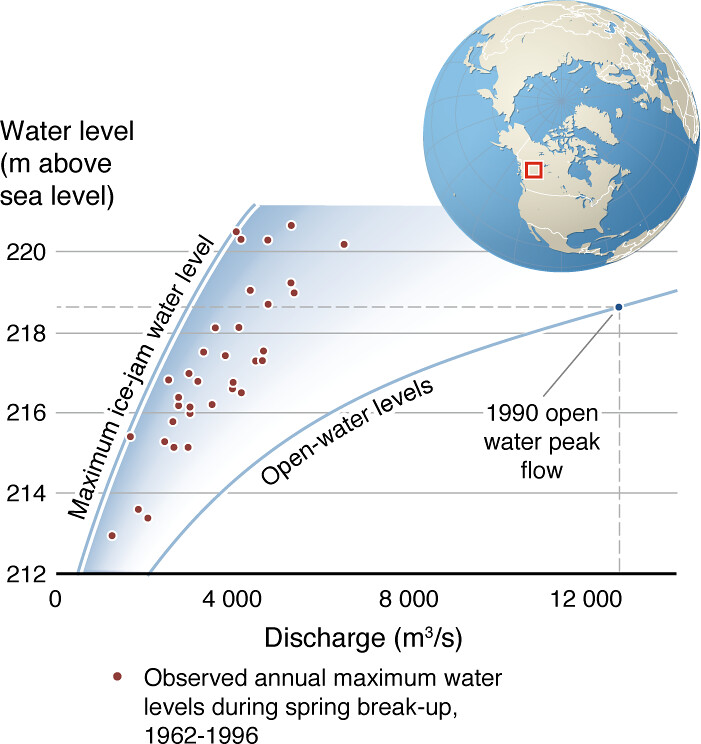
Example of enhanced water levels produced from river ice, Liard River, Canada
The lower curve shows the correspondence between river flow and water levels under open-water conditions. The much greater maximum water levels possible under ice-jam…

- Single Image File
World ocean thermohaline circulation
The global conveyor belt thermohaline circulation is driven primarily by the formation and sinking of deep water (from around 1500m to the Antarctic bottom…

- Single Image File
Arctic sea ice minimum extent in September 1982 and 2007
The red line indicates the median minimum extent of the ice cover for the period 1979–2000. This figure compares the Arctic sea ice extent…

- Single Image File
Glacier changes on Nevado de Santa Isabel, Colombia
With spectacular mountain peak glaciers melting away, the Nevado de Santa Isabel area in Colombia becomes less attractive to tourists. In addition, the local…