

- Single Image File
Total population: access to an improved water source
The 2004 global image sadly shows that the lack of access to clean water remains a burden for the poorest countries, preventing them accelerating…

- Single Image File
Renewable surface water produced internally
It is difficult to determine the amount of renewable water produced internally from the total renewable water resources (external and internal). However the FAO…

- Single Image File
Planet index 2007 for marine species population
The Marine Species Population Index provides an assessment of the average changeover time in the populations of 217 species of marine mammals, birds, reptiles,…
- Single Image File
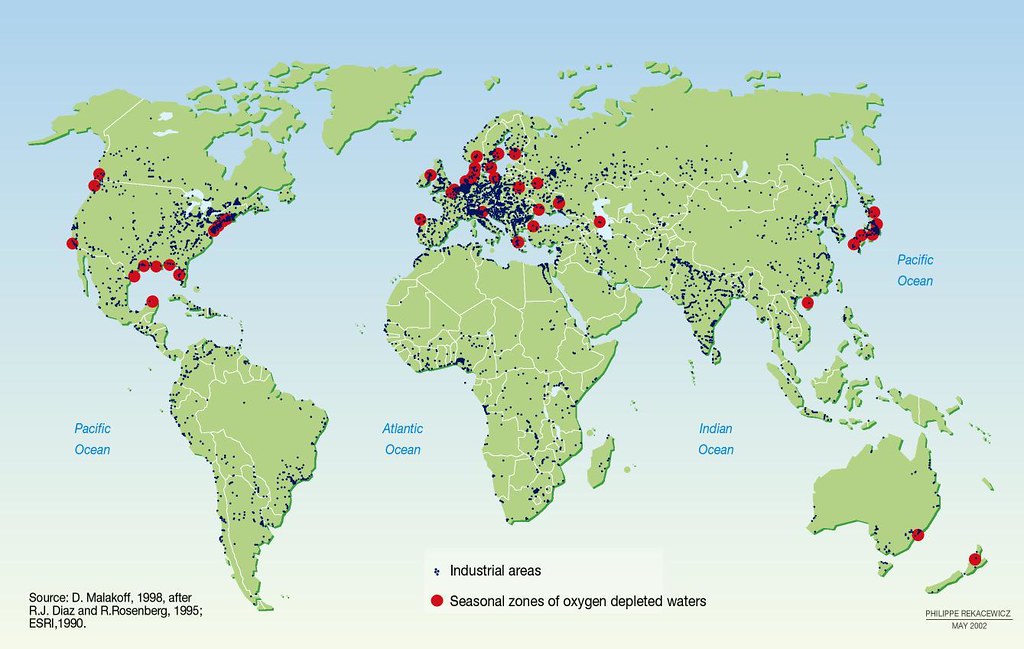
Industrial areas and seasonal zones of oxygen depleted waters
This graphic illustrates the strong link between areas with high densities of industrial activity and zones of seasonally oxygen-depleted waters. There is a strong…

- Single Image File
Suspended sediment discharge
Asia exhibits the largest runoff volumes and, therefore, the highest levels of sediment discharge. Due to their high precipitation, the Oceanic Islands have disproportionately…

- Single Image File
Water Scarcity Index
Water overuse is damaging the environment in many major basins. High overuse tends to occur in regions heavily dependent on irrigated agriculture, such as…

- Single Image File
Freshwater use by sector at the beginning of the 2000s
The agricultural sector is by far the biggest user of freshwater. Analysis indicates that: - In the United States, agriculture accounts for some 49%…

- Single Image File
Meat imports in 2005
Meat imports in 2005 & Meat consumption.

- Single Image File
The boom in shipping trade
Map showing The boom in shipping trade and a graphic showing world imports.

- Single Image File
Examples of GHG emission amounts 03
Examples of GHG emission amounts generated by different activities or goods are scattered across the book in the form of proportional bubbles (in kilograms…

- Single Image File
Examples of GHG emission amounts 05
Examples of GHG emission amounts generated by different activities or goods are scattered across the book in the form of proportional bubbles (in kilograms…

- Single Image File
Do you really save time?
Train versus plane in a busy world.