

- Single Image File
Electricity Consumption
The graph shows the consumption of electricity in kWh per capita. The graph shows that developed countries, and Nordic nations in particular have the…

- Single Image File
Swedish Emissions of Greenhouse Gases, 1990-1995
The graph shows Swedish emissions of anthropogenic greenhouse gases from 1990 to 1995 and projections to 2020 according to second national communications to UNFCCC.…

- Single Image File
Trends in Phosphorus Loads and Concentrations, Baltic Sea, 1900-2030
The graphic shows trends in Phosphorus loads and concentrations in the Baltic Sea from 1900 to 1995 with projections to 2030. Phosphorus is an…

- Single Image File
Electricity Generation by Sources in the Nordic Countries in 1996
The graph shows the electricity generation by sources in the Nordic countries in 1996. Nordic countries have a highly developed energy marked, particularly in…

- Single Image File
Total Consumption of Fertilizers in the Nordic Countries
The graph shows the consumption of fertilizers in the Nordic countries form 1980 to 1996 with projections to 2006. The fertilizers included are phosphate,…

- Single Image File
PCB and DDT in Guillemot Eggs, Baltic Proper, 1972-1994
The graphic shows PCB and DDT in Guillemot eggs, Baltic proper (1972-1994). To assess the current contaminant pressure on the common guillemot (Uria aalge)…

- Single Image File
Exchanges of Electricity in 1996 in the Nordic Countries
The graphic shows exchanges of electricity in the Nordic countries in 1996. The Nordic countries have a long tradition of cross-border cooperation in providing…
- Single Image File
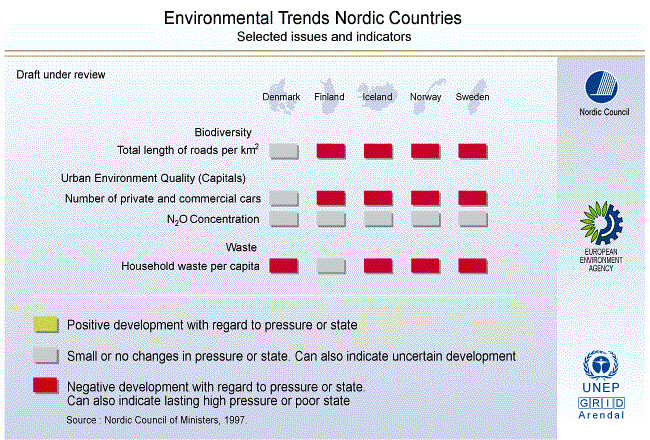
Environmental Trends Nordic countries (part 3)
This illustration shows positive and negative developments in areas such as household waste per capita, urban environment Quality, biodiversity and number of private and…

- Single Image File
Projections to 2020 of Greenhouse Gas Emissions, 1990-1995
The graphic shows emissions of anthropogenic greenhouse gases from 1990 to 1995, with projections to 2020. The main greenhouse gases are CO2, CH4, N2O,…

- Single Image File
Environmental Policy Responses
This graphic shows the general responses to the need for policy from region to region around the world. The trend looks optimistic that many…
- Single Image File
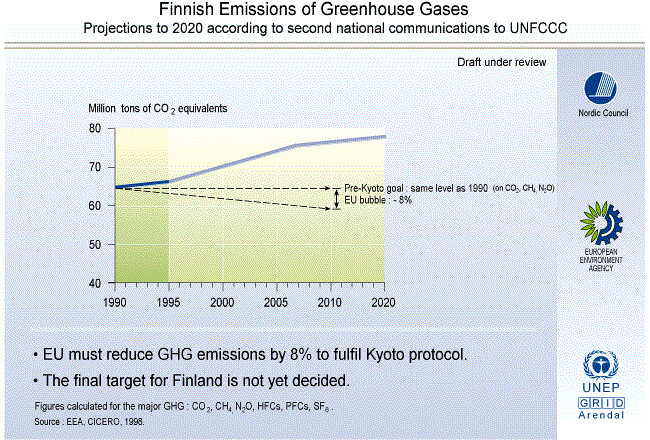
Finnish Emissions of Greenhouse Gases, 1980-1996
The graph shows Finnish emissions of anthropogenic greenhouse gases from 1980 to 1996 with projections to 2010 according to second national communications to UNFCCC.…

- Single Image File
Exchanges of Electricity in the Nordic Countries in 1996
The graph shows exchanges of electricity in the Nordic countries in TWh. The Nordic countries have a long tradition of cross-border cooperation in providing…