

- Single Image File
General schematic showing typical modes of gas hydrate occurrence relative to the geologic environment
Thin (A) and thickly veined (B) sediment-displacing gas hydrates (white) in fine-grained sediment (grey); (C) pore-filling gas hydrates in sand; (D) gas hydrate mounds…

- Single Image File
The carbon cycle
Carbon moves through the atmosphere, biosphere, geosphere, and hydrosphere.Gas hydrates (orange) are shown in marine sediments, but are also buried beneath permafrost sediment in…

- Single Image File
Future change in bottom-water temperatures at the sea floor
Changes are given in °C per 100 years as predicted by the Kiel Climate Model (KCM) (Park et al. 2009), for a pCO2 increase…

- Single Image File
Gas hydrates resource potential by global regions
This figure includes only that subset of global in-place gas hydrates that appear to occur at high concentrations in sand-rich reservoirs, the most likely…

- Single Image File
Well completion for gas hydrate production
Well schematics show possible horizontal and vertical well completions for a gas hydrate production well employing the depressurization technique.

- Single Image File
Schematic of a submarine slide triggered by gas hydrate dissociation
In theory, gas pressure generated by methane released during gas hydrate dissociation weakens the sediment and provides a glide plane for sediment failure. In…
- Single Image File
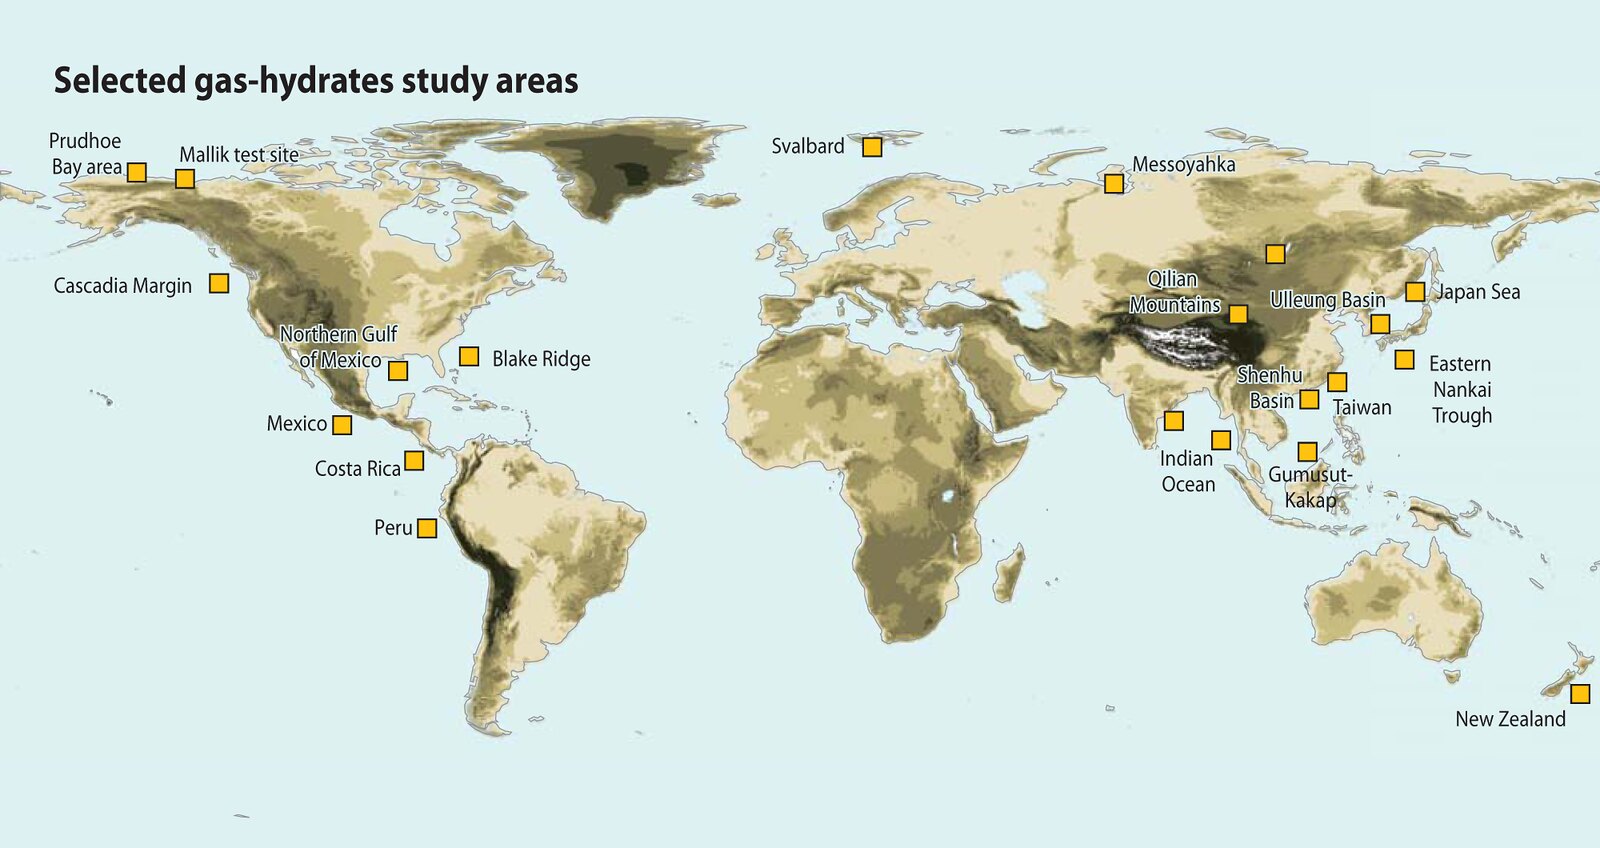
Selected gas hydrate study areas
The yellow squares indicate a few of the historically-significant gas hydrate research sites, along with locations where gas hydrates have been recovered from depths…

- Single Image File
Primary sources of methane release
Methane emissions due to human-related activities, shown to the right of the volcano, account for approximately 70 per cent of the total emissions (Reeburgh…

- Single Image File
Gas hydrate landmark findings
Timeline of major milestones in gas hydrate (GH) research.
- Single Image File
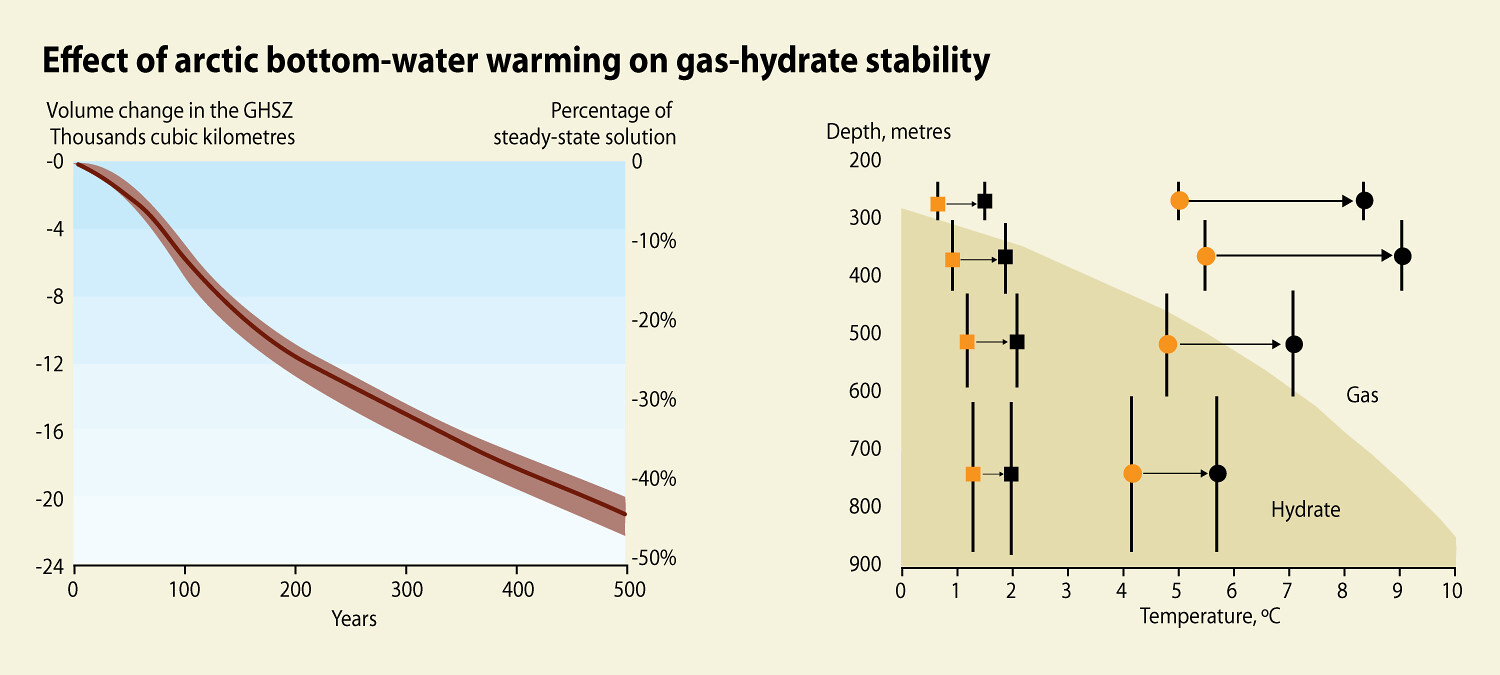
Effect of arctic bottom-water warming on gas hydrate stability
Left: Changes in the thickness of the GHSZ caused by the bottom-water temperature increase depicted in Figure 3.5. Above left: Volumetric GHSZ thickness changes…

- Single Image File
Penetration of heat into marine sediments
The left panel shows the increase in temperature with depth for sediments, located at 1000 metres water depth, that are exposed to linear bottom-water…

- Single Image File
Predicted increase in global mean surface-air temperatures
Increases are relative to 1980–1999 for different emission scenarios (IPCC 2007). The partial pressure of carbon dioxide in the atmosphere (pCO2) is assumed to…