

- Single Image File
Relative changes in food supply (crops and livestock): industrial and developing countries
Over the past 40 years, globally, intensification of cultivated systems has been the primary source (almost 80%) of increased output. But some countries, predominantly…

- Single Image File
Locations reported by various studies as undergoing high rates of land cover change in the past few decades
In the case of forest cover change, the studies refer to the period 1980–2000 and are based on national statistics, remote sensing, and, to…

- Single Image File
Total carbon market value per year
The total value of the carbon market for 2003 topped $300 million. And, depending on international regulation, some observers project that it will increase…

- Single Image File
Net national savings in 2001 adjusted for investments in human capital, natural resource depletion, and damage caused by pollution compared with standard net national savings measurements
Positive values for national savings (expressed as a percent of gross national income) reflect a gain in wealth for a nation. Standard measures do…

- Single Image File
Forest systems
Forest systems are lands dominated by trees; they are often used for timber, fuelwood, and non-wood forest products. The map shows areas with a…

- Single Image File
Proportion of population with improved sanitation coverage in 2002
Access to improved sanitation is estimated by the percentage of the population using the following sanitation facilities: connection to a public sewer, connection to…

- Single Image File
Human population growth rates, 1990–2000, and per capita Gross Domestic Product (GDP) and biological productivity in 2000 in ecological systems
Millennium Assessment systems with the lowest net primary productivity and lowest GDP tended to have the highest population growth rates between 1990 and 2000.…
- Single Image File
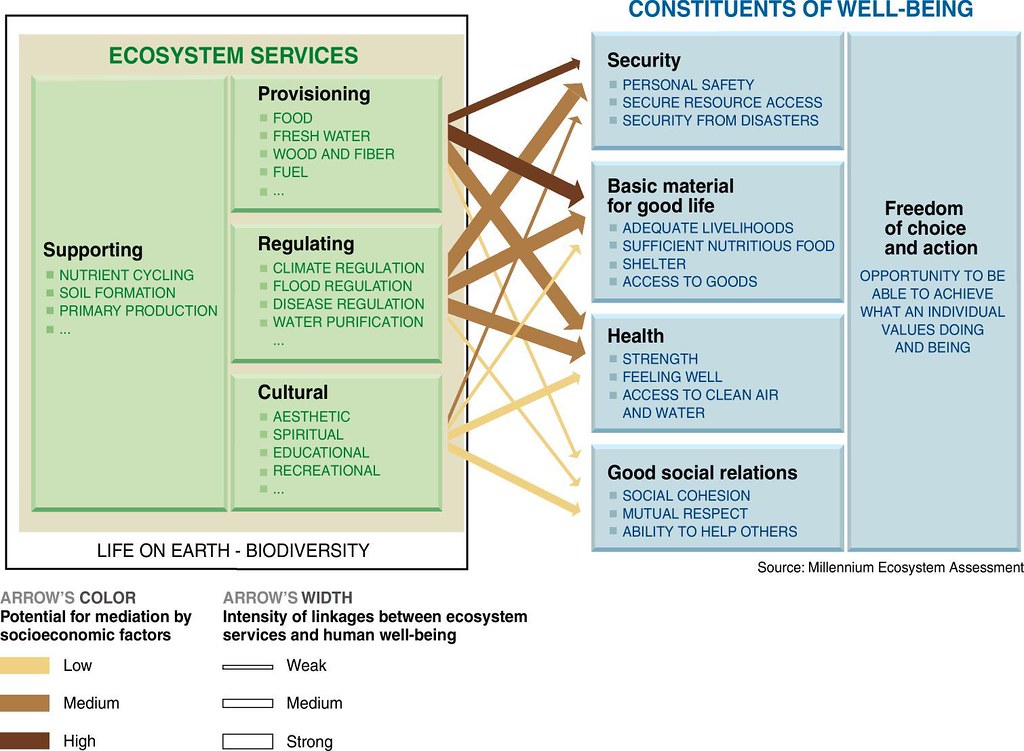
Linkages between ecosystem services and human well-being
There are many linkages between categories of ecosystem services and components of human well-being. They includes indications of the extent to which it is…

- Single Image File
Local adaptations of Millenium Assessment (MA) conceptual framework
The MA framework was applied in a wide range of assessments at multiple scales. Particularly for the more local assessments, the framework needed to…

- Single Image File
Reactive nitrogen on earth by human activity, with projection to 2050
The range of the natural rate of bacterial nitrogen fixation in natural terrestrial ecosystems (excluding fixation in agroecosystems) is shown for comparison. Human activity…

- Single Image File
Urban, dryland, and polar systems
Urban systems are built environments with a high human density. For mapping purposes, the MA uses known human settlements with a population of 5,000…

- Single Image File
Contribution of ecosystems to historical radiative forcing and current greenhouse gas emissions
Radiative forcing caused by changes in atmospheric composition, alteration in land surface reflectance (albedo), and variation in the output of the sun for the…