

- Single Image File
World population scenarios
Some factors (such as global population growth) will begin to decline in importance and others (distribution of people, climate change, and changes to nutrient…

- Single Image File
Estimated global marine fish catch, 1950 -2001
Fishing production dramatically increase through the century peaking in late 1980s. At this time there were major declines in several fish populations in different…

- Single Image File
Changes in agricultural land (pasture and cropland)
For all developing countries over the period 1961–99, expansion of harvested land contributed only 29% to growth in crop production versus the contribution of…

- Single Image File
Collapse of Atlantic cod stocks off the East Coast of Newfoundland in 1992
From the late 1950s, offshore bottom trawlers began exploiting the deeper part of the stock, leading to a large catch increase and a strong…

- Single Image File
Main direct drivers of change in biodiversity and ecosystems (CWG)
The cell color indicates impact of each driver on biodiversity in each type of ecosystem over the past 50–100 years. High impact means that…

- Single Image File
Global production, prices, and undernourishment
Food production more than doubled (an increase of over 160%) from 1961 to 2003. Over this period, production of cereals—the major energy component of…
- Single Image File
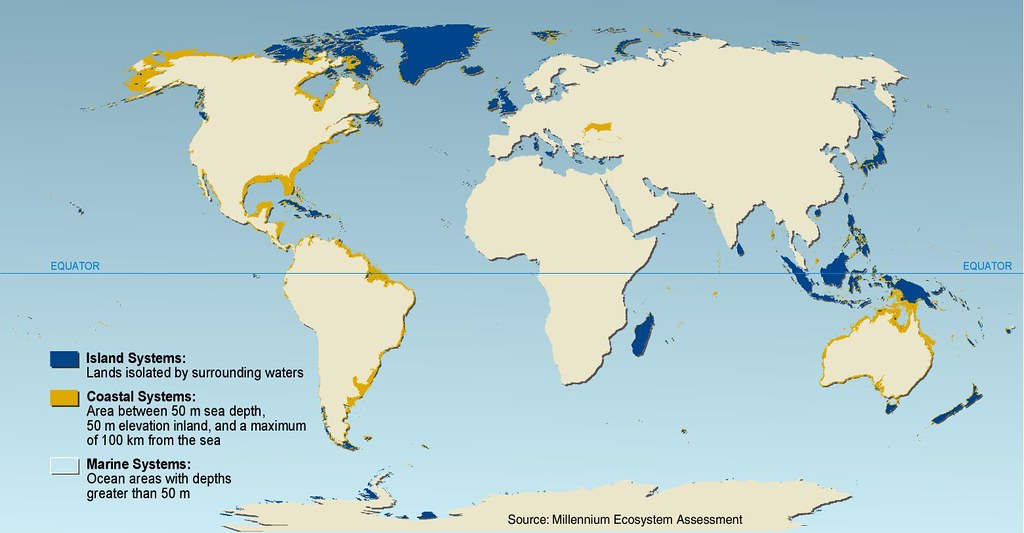
Marine, coastal, and island systems
Marine systems are the world’s oceans. For mapping purposes, the map shows ocean areas where the depth is greater than 50 meters. Global fishery…

- Single Image File
Extent of cultivated systems, 2000
More land was converted to cropland in the 30 years after 1950 than in the 150 years between 1700 and 1850. Cultivated systems (areas…

- Single Image File
Number of flood events by continent and decade since 1950
Roughly 17% of all the urban land in the United States is located in the 100-year flood zone. Likewise, in Japan about 50% of…

- Single Image File
Locations reported by various studies as undergoing high rates of land cover change in the past few decades
In the case of forest cover change, the studies refer to the period 1980–2000 and are based on national statistics, remote sensing, and to…
- Single Image File
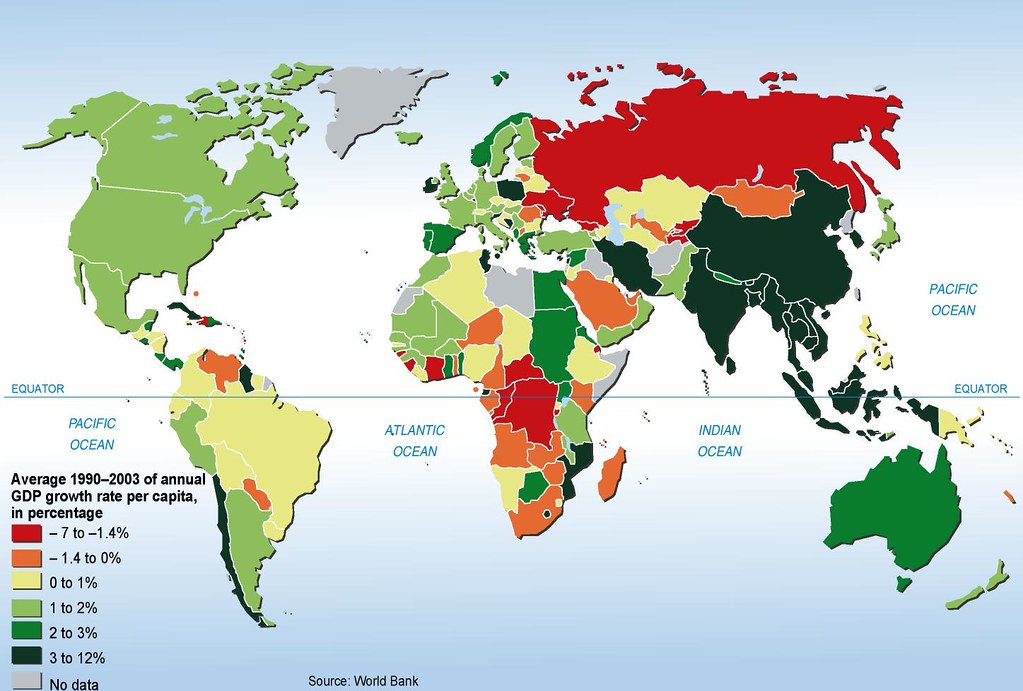
Per capita gross domestic product (GDP) average annual growth, 1990–2003
Average annual percentage growth rate of GDP per capita at market prices based on constant local currency. Dollar figures for GDP are converted from…

- Single Image File
Millennium Ecosystem Assessment conceptual framework
International demand for timber may lead to a regional loss of forest cover, which increases flood magnitude along a local stretch of a river.…