

- Single Image File
World gas consumption
The graphic shows the world gas consumption from various regions in comparison to the world totals. It shows trends from 1990 to 1999 and…

- Single Image File
Global energy use 1994

- Single Image File
Share of population with access to improved drinking water
There are currently more than 1000 million people in the world that lacks access to an easily accessible and safe water source, such as…

- Single Image File
Status on cost of establishing a business
Bureaucracy and administration by local and national government can present a stumbling block for establishing businesses - in particular for micro, small and medium-sized…

- Single Image File
Total and indigenous populations of the Arctic: Alaska
The graphic shows the population between indigenous and non-indigenous people in Alaska. The indigenous peoples include Iñupiaq and Yup'ik Inuit, Alutiq (Aleuts) and Athapaskans.…

- Single Image File
Global International Water Assessment Tools (GIWA)
The graphic shows the process of GIWA's assessment methodology and list the five main concerns dealing with water resources, which are freshwater shortage, pollution,…

- Single Image File
Total energy supply in 1995
Total primary energy supply per capita is a common, albeit an imperfect measure of energy efficiency in a country. For instance, neither the impact…
- Single Image File
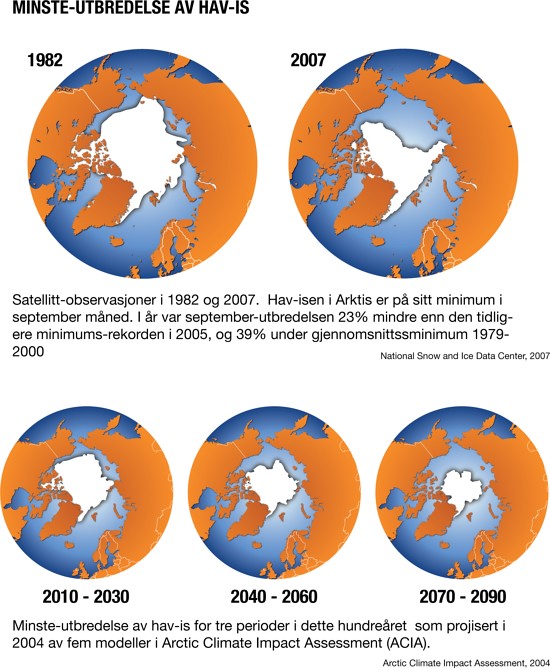
The decrease of Arctic sea ice, minimum extent in 1982 and 2007, and climate projections [Norwegian]
Satellite observations of the September extent of sea ice in the Arctic shows in 2007 shows a 23% decrease from the previous minimum, in…

- Single Image File
World consumption and prognoses of primary energy
The graphic shows the world oil, natural gas and coal consumption from various regions in comparison to the world totals. It Shows trends from…

- Single Image File
Loss of tropical forest in developing regions, 1980-1990
The graphic shows the amount and rate of deforestation in Latin America and the Caribbean, Asia and Sub-Saharan Africa from 1980 to 1990. Tropical…

- Single Image File
Global Freshwater Withdrawal in the Year 2000
World map showing annual levels of renewable water resources for the year 2000 measured in cubic meters. The use of water varies greatly from…

- Single Image File
World oil consumption
The graphic the world oil consumption from various regions in comparison to the world totals. It shows trends from 1990 to 2001 and predicts…