

- Single Image File
World consumption and prognoses of primary energy
The graphic shows energy consumption of oil, coal and natural gas in various regions around the world from 1990 to 2002 and predicts future…

- Single Image File
World CO2 emissions
The graphic shows the world's total CO2 emissions in million metric tonnes carbon equivalent. Broken down into categories of total fuel fossil emissions, oil,…

- Single Image File
Species Diversity of the Regional Seas in the 1990s
The graphic compares the amount of diversity of marine mammals, sharks, molluscs, birds, shrimp and lobsters in various sea regions. Coral reefs are among…
- Single Image File
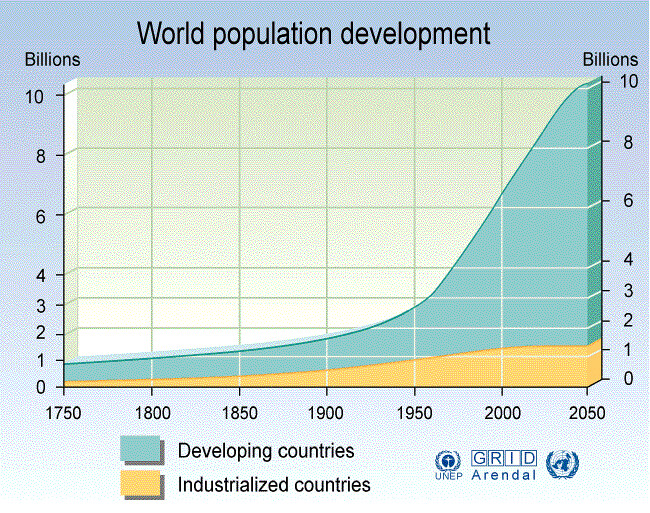
World population development
World population exceeded 6.1 billion individuals in 2001, and is growing at about 1.3% annually. Over sixty percent of the world’s population lives in…

- Single Image File
World Capture Fisheries and Aquaculture Production
Shows the amount, in million tonnes, of fish taken by capture and aquaculture fisheries, between the years 1950-1999. Also included is a diagram showing…

- Single Image File
CO2 emissions from coal, gas and oil for selected regions
Graph showing the amount (in millions of metric tonnes) of CO2 emissions from coal, gas and oil. Covers the years from 1990-2000 and predicts…

- Single Image File
Global fertilizer consumption
In recent years, there has been concern that the quantity of mineral fertilizers used in agriculture having adverse effects on the environment. Attention has…

- Single Image File
Major river systems in the Arctic
The Arctic has several of the world’s largest rivers.This graphic shows the major river systems of the Arctic and their annual discharges in cubic…

- Single Image File
CO2 emissions from industrial processes and land use change
2 thematical maps: (1) CO2 emissions from industrial processes: This map depicts the unequal distribution of industry in the world. The significant part of…

- Single Image File
Statistical Distribution of Biological Oxygen Demand
The graphic is a global comparison of the biological oxygen demand measured in milligrams per litre. It covers the years from 1976-2000. The biological…

- Single Image File
Status of global fisheries stocks
The graphic compares biomass to fish mortality to summarize the amount of exploitation on fish stocks globally. Fish is considered important to human diet,…

- Single Image File