

- Single Image File
Global Average Nitrate Levels
Considering the data for all the rivers at the continental level, there has been little change in nitrate (NO3-N) concentrations between the two decades…
- Single Image File
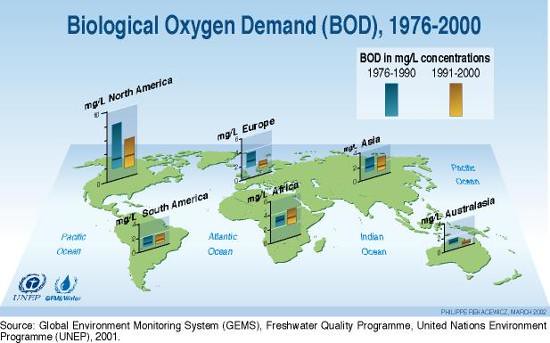
Biological Oxygen Demand (BOD), 1976-2000
Biochemical oxygen demand is an indicator of the organic pollution of freshwater. Alkalinity (concentration of calcium carbonate or CaCO3) is another indicator of freshwater…
- Single Image File
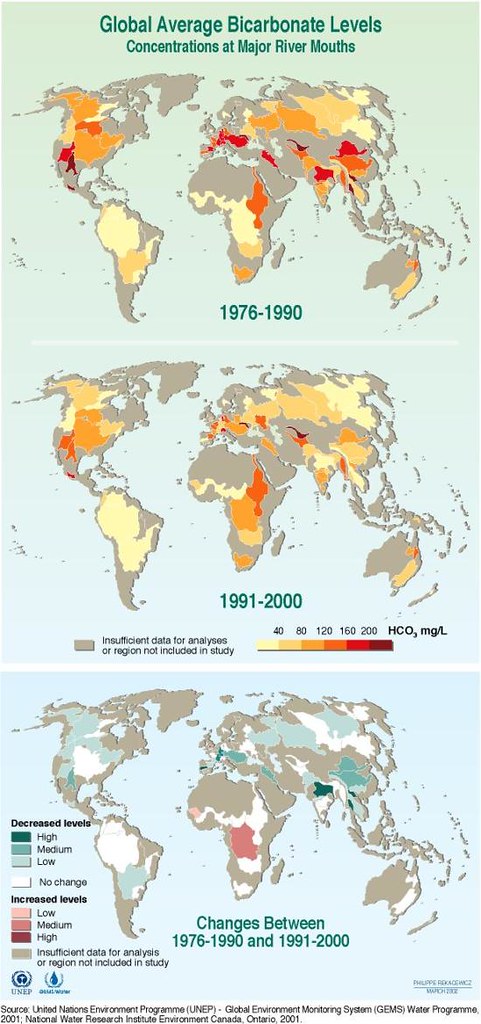
Global Average Bicarbonate Levels
This graphic shows the average bicarbonate concentrations, in milligrams per litre, at major river mouths for the time periods 1976 to 1990 and 1991…

- Single Image File
Global Sediment Loads
Asia exhibits the largest runoff volumes and, therefore, the highest levels of sediment discharge. This graphic shows the amounts of suspended sediments discharged, in…

- Single Image File
Changes in Catch Ratios of Predatory and Plankton Feeding Fish
Three-quarters of fish stocks are currently exploited to the maximum extent, if not excessively. The Northeast Atlantic Ocean continues to exhibit declining catches, as…
- Single Image File
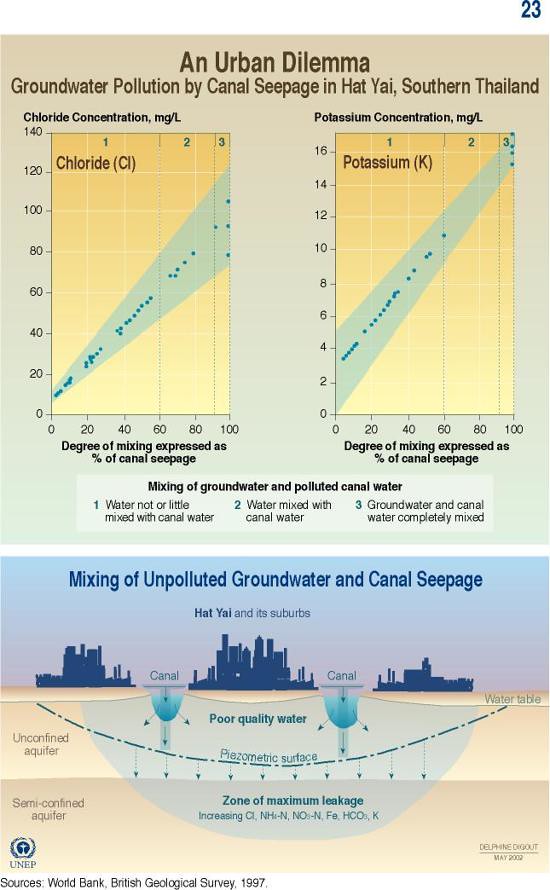
Groundwater Pollution by Canal Seepage in Hat Yai, Southern Thailand
In areas where surface water is not readily available (located far away from areas where it is needed), groundwater is the primary water source.…

- Single Image File
Coastal Population and Shoreline Degradation
Coastal areas with high population densities are those with the most shoreline degradation or alteration. Densely populated areas close to seas are also the…

- Single Image File
River Runoff through the 20th Century
River runoff represents the accumulated water, from precipitation and meltwater, that feeds into rivers that feeds into seas. The estimated annual figures in this…

- Single Image File
Freshwater Alkalinity, 1976-2000
Alkalinity (as CaCO3) was analysed for all sampling stations available at the continental level. Concentrations remained reasonably steady between the two decades for Africa,…

- Single Image File
Global Average Calcium Levels
This graphic shows the average calcium levels, in milligrams per litre, at major river mouths for the time periods 1976 to 1990 and 1991…

- Single Image File
Global International Waters Assessment Tools
Global International Waters Assessment's (GIWA) assessment tools for monitoring the world's water resources, incorporating five major environmental concerns and application of the DPSIR framework…

- Single Image File
Trends in Marine and Freshwater Populations
The Marine Species Population Index provides an assessment of the average change over time in the populations of 217 species of marine mammals, birds,…