
- Single Image File
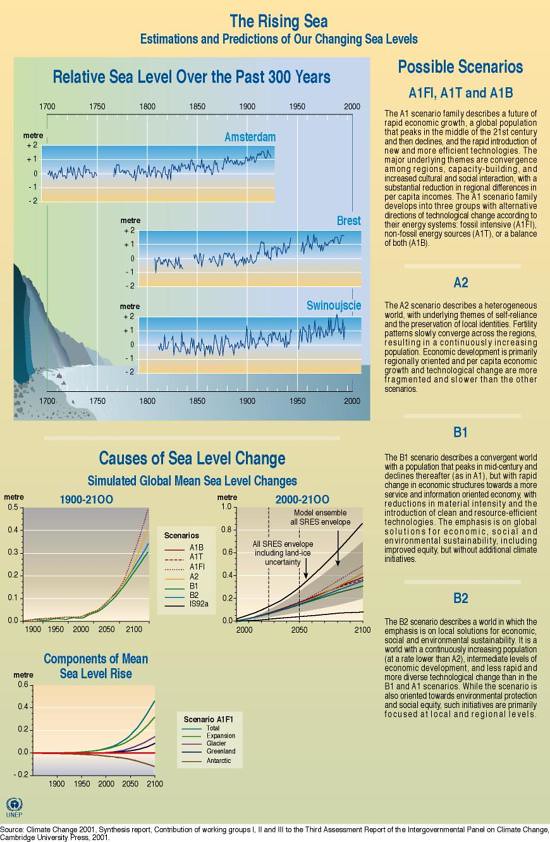
The Rising Sea: Estimations and Predictions
This resource includes four graphics that explain sea level change, an expected consequence of climate change. The first graphic, 'Relative Sea Level Over the…

- Single Image File
The World’s Water Cycle
The water cycle consists of precipitation, evaporation, evapotranspiration and runoff. This graphic explains the global water cycle, showing how nearly 577 000 km3 of…

- Single Image File
Aral Sea: trends and scenarios
The demise of the Aral Sea was caused primarily by the diversion of the inflowing Amu Dar'ya and Syr Dar'ya rivers to provide irrigation…

- Single Image File
A Chronology of Change: Natural and Anthropogenic Factors Affecting Lake Chad
Straddling the borders of Nigeria, Chad, Niger and Cameroon in West Africa, Lake Chad has been a source of freshwater for irrigation projects in…

- Single Image File
From Wetlands to Dry Lands: The Destruction of the Mesopotamian Marshlands
The Mesopotamian marshlands in the Tigris and Euphrates river basins were devastated by damming and river channelization during the late 1980s. This graphic illustrates…

- Single Image File
Fish Diversity in Freshwater Systems
Although freshwater ecosystems such as rivers, lakes and wetlands occupy less than 2% of the Earth's total land surface, they provide a wide range…

- Single Image File
Global Freshwater Resources
Glaciers and icecaps contain approximately 70% of the world's freshwater, but groundwater is by far the most abundant and readily available source of freshwater.…

- Single Image File
Species Diversity in the World’s Seas, 1990-1998
There is growing evidence that many marine species are less widely distributed, and therefore more vulnerable to extinction, than previously thought. This graphic shows…

- Single Image File
Global Distribution of Coral, Mangrove and Seagrass Diversity
Similar to corals, the region of greatest mangrove diversity is in Southeast Asia, particularly around the Indonesian Archipelago (Burke et al., 2001). There are…

- Single Image File
Evolution of Global Water Use
Throughout the 20th century, global water use has increased in the agricultural, domestic and industrial sectors. Evaporation from reservoirs has increased at a slower…

- Single Image File
Freshwater Stress
This graphic shows the amount of water withdrawal as a percentage of the total available supply, at the national level in 1995 and in…

- Single Image File
River Runoff through the 20th Century
River flow is cyclical in nature, with alternating cycles of wet and dry years. This graphic uses bar graphs to show the average annual…